
On any given day someone is hosting a conversation on the Internet, or in some place, where they are talking about poverty, inequality, education, race, social justice, workforce diversity and quality, etc.
I participate in many of these via Twitter chats, Facebook live videos, etc. In addition I read many blogs where others share their knowledge and ideas. In my own posts I try to draw people to the ideas I've been sharing for the past 20-plus years..plus the ideas an information all these other people have been sharing.
I started putting this information onthe Internet in 1998.
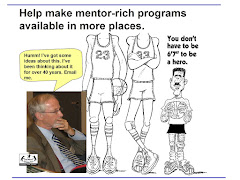
I use graphics to visually communicate these ideas and to emphasize that helping kids from birth to work, in all neighborhoods with high poverty, requires a planning process that engages people from every sector, for many years. If you do a Googlesearch for “tutor mentor” then look at the images, you'll see many graphics like this, and be able to click on the article where the graphic was used.

Below is another graphic that illustrates the same idea. In this case I'm emphasizing a year-round process that is on-going. As volunteers and students join tutor/mentor programs in September, the program will work throughout the year to help them connect and build positive relationships from those connections. Those connections can take place in three different time frames, and different types of locations, ranging from the local school, to a community based youth serving organization.

Throughout this blog and articles on the MappingforJustice blog I use maps to emphasize a need to support high quality youth programs in every high poverty neighborhood, not just a few high profile programs, or a few pilot programs, in a few places. Maps show where help is needed, and can also show what programs are available. They can even show where help is being provided, and by whom. Maps can be used in stories that draw attention to small sections of the city, or to the entire city. Use the examples from my blog articles to create your own.
If a youth is in elementary school when he/she joins a program, the cycle of support needs to repeat for 6-8 years just to help the youth complete high school.
If a youth is in elementary school when he/she joins a program, the cycle of support needs to repeat for 6-8 years just to help the youth complete high school.

Many people need to be involved in this process, including the business community, health care and legal professions, educators, parents, youth, faith based communities, etc. “It takes a village” is a true statement.

The blue box on the above graphic can be filled by many people, ranging from school-age students to senior citizens. The graphic at the right illustrates how resources grow over a period of years with consistent support, especially if it comes from highly visible people. Program design should encourage involvement from multiple sources of volunteers. Leaders from different industries should be pointing to programs throughout a city where volunteers, donors, tech support, etc. needs to be involved. Commitment should be on-going, lasting many years.
I illustrate this with the graphics below.

While people bring their own knowledge and experiences into a conversation, few conferences, social media chats, or webinars, encourage and/or enable a deeper sharing of ideas among participants at the event, or after. By using graphics and maps like these, I constantly point to information in web libraries and articles on my blog, and encourage people to visit, read and reflect, as part of their own personal learning commitment. Here's a link to a section of the Tutor/Mentor library, that points to dozens of blogs that I think are worth following.

I also point to ways that geographic maps and social network analysis maps can be used to show who is participating in a conversation and how they are connecting to each other. Here's a recent blog article written by Kevin Hogdson, a middle school teacher from Western Mass, that points to these tools. You can see several maps of an Innovation Mindset #IMMOOC that is taking place in Sept-Oct 2016.

In 2000 the Tutor/Mentor Connection launched an on-line documentation system where people could report key actions they had taken to further the T/MC mission. This video describes that system (which is not available as of 2013 due to my own lack of funding and tech support.). I share the video to demonstrate the type of accountability that is needed in multi-sector problem solving.
Each of these graphics is included in one or more articles I've written and shared since 1994, first in printed newsletters, then in email newsletters and since 2005 on this and other blogs. I created the tag cloud graphic to emphasize the wide range of ideas that are available, and to show that doing a Google or Bing search using “tutor mentor” plus any one of the terms in the graphic below, will bring up one of my articles.

Anyone can do this, on any day of the week, and at any time during the day. The challenge is finding ways to motivate people to take the time to search out articles, then read and reflect. One solution is to recruit educators, Bible school facilitators, R&D people in companies, to take the lead. Another is to create a college degree track, where students look into this information regularly for several years as they earn a degree, then for the rest of their lives as they apply what they are learning.

That's what this graphic is illustrating. If one person takes the time to dig into the articles on web sites like mine, he/she can lead a discussion that helps other people understand and apply these ideas.
This graphic and many others were created by interns who spent time with me from 2005-2015. See some of their work here and here. Use this as examples of what your own volunteers and students could be doing to help draw people from many sectors into this complex web of information, ideas and solutions.


No comments:
Post a Comment