
Today in my feed I received this article from the Community Commons organization, which shows how to use map stories in neighborhood collaborations. This article describes a workshop the Community Commons team was leading, which diverted from the planned script to one where the group was asking:
"what kinds of data could help them."
The responses were categorized into two areas:
The responses were categorized into two areas:
- data that already existed
- data they would need to collect"

These two questions are questions that have driven my work for 20 years. If you look at this PDF it describes a 4-part strategy intended to involved people from all parts of the Chicago region in efforts that help youth in high poverty neighborhoods connect with extra adults who help them move through school and into jobs and careers.
Collecting this data is part of Step 1. Creating year-round communications strategies that draw more people to the information is Step 2. Helping people understand and apply the information is step 3. Map stories are part of Step 2 and Step 3.
Building a team of people and resources to do the work required in Step 2 and 3 has been a continuous challenge.
Building a team of people and resources to do the work required in Step 2 and 3 has been a continuous challenge.
This leads to a second article I want to share with you.
I attend weekly Chicago Hack Night meetings at the Merchandise Mart where I hear speakers share interesting ideas about using technology to do good things in communities and where I expand my network of technologists. On this week's agenda I was encouraged to read this article, by Ethan Zuckerman.
I attend weekly Chicago Hack Night meetings at the Merchandise Mart where I hear speakers share interesting ideas about using technology to do good things in communities and where I expand my network of technologists. On this week's agenda I was encouraged to read this article, by Ethan Zuckerman.
In t he middle of the article is this sub-head:
"Make sure you're solving the right problem."
This is a long, and thoughtful article. I hope you'll read it. I've included a link in my web library to Ethan Zukerman's blog since the middle 2000s. It's one of many articles that I would include in the category of "data that already exists" which I encourage people focusing on the well-being of youth or reductions in poverty and inequality to read.

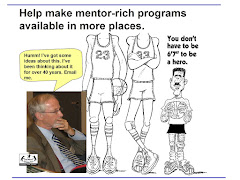
"Some focus on the act of mentoring. I focus on the infrastructure that makes it possible."
Data maps, and map stories, can show all the places in Chicago where kids and families and schools need a lot of extra help, for many years, if the result is kids in jobs and careers when they are in their 20's and 30's. I hope more leaders will use these tools and focus on what type of infrastructure and support systems are needed to make that a reality.


No comments:
Post a Comment